
In the fast world of digital design, teams face a big challenge. First, they want to build beautiful, bold products that stand out. Second, they must prove these designs actually work for the business. Combining “cool” web trends with the hard work of measuring UX metrics is the secret to a great workflow.
It is no longer enough to make a site look pretty. Today’s designers must use data-driven creativity. This means every animation or layout is backed by psychology. It also means you are constantly measuring UX metrics to ensure users are happy. This guide shows you how to balance wild creativity with the data needed to prove your worth.
Check out: https://www.youtube.com/watch?v=aORI0IzMpYo
Table of Contents
1. The Rise of Limitless Design and the No-Code Revolution.

For a long time, web design was limited by code. Designers had to wait for developers to build their ideas. This often slowed things down. Today, we have a “no-code revolution.” This change is helping teams build products faster than ever.
Tools like Webflow let designers build powerful sites without writing code. You can move past boring templates. You can create unique, immersive journeys for your brand. By skipping the slow hand-off to developers, you can focus on measuring UX metrics earlier in the process.
This freedom lets you rethink how a site works. You can try new menus and navigation styles. When a user clicks through a site that feels fluid, they remember it. But remember, the goal isn’t just to be different. The goal is to see how these changes perform by measuring UX metrics. If a new menu confuses people, the data will show it.
2. The Playground Mindset: Advanced Animations and Web Experiments.

As it gets easier to build complex sites, a new “playground” mindset has arrived. Designers are now exploring bold web experiments. They are trying radical layouts that challenge the old ways of doing things
A great place for ideas is Codrops. Since 2009, it has shown the latest in animation and styling. One big trend is using on-scroll animations. Instead of a flat page, content moves as the user scrolls down. This creates a cinematic feel.
However, visual flair must have a purpose. You shouldn’t make things move just for fun. You should use animation to tell a story. To know if your animations are working, you must stay focused on measuring UX metrics. Are users staying on the page longer? Are they clicking the right buttons? Measuring UX metrics helps you find the sweet spot between “exciting” and “distracting.”
3. The Danger of Over-Design: Clarity as the North Star.
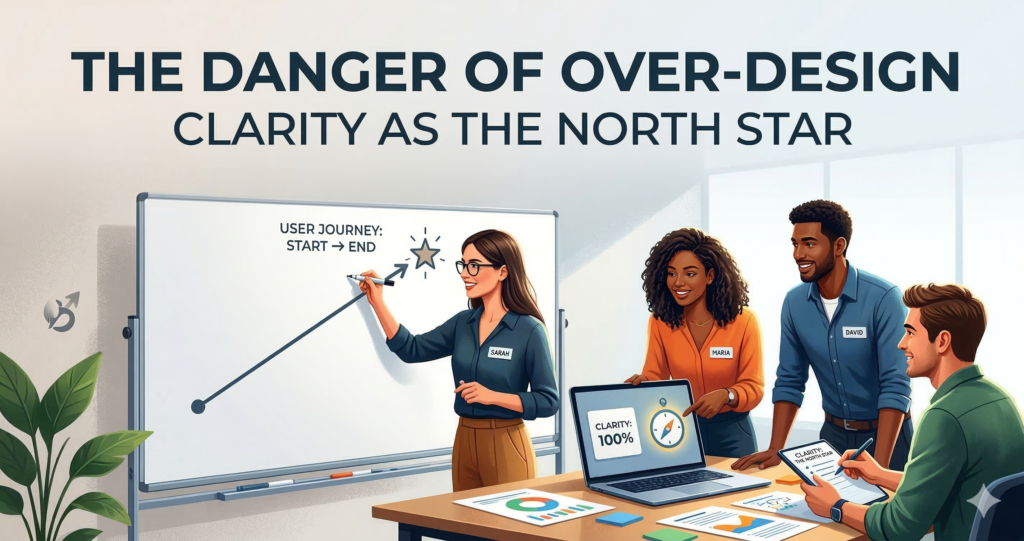
There is a big risk in having so much creative freedom. It is called “over-design.” If a site is too flashy, it can become hard to use. If a user gets lost, your design has failed. This is why Information Architecture (IA) and Content Design are so important.
Clarity should always be your main goal. Look at how top companies like Intercom handle this. They restructured their whole system to make it easier for users. They learned that even as you grow, you must keep things simple.
To master this, follow experts like Amy Bucher and Jorge Arango. They teach the science of UX structure. Also, remember that words matter as much as pictures. Your branding and your text must work together. By measuring UX metrics related to how fast people find information, you can see if your structure is solid.
4. The Intersection of Data, Behavioral Psychology, and UX.
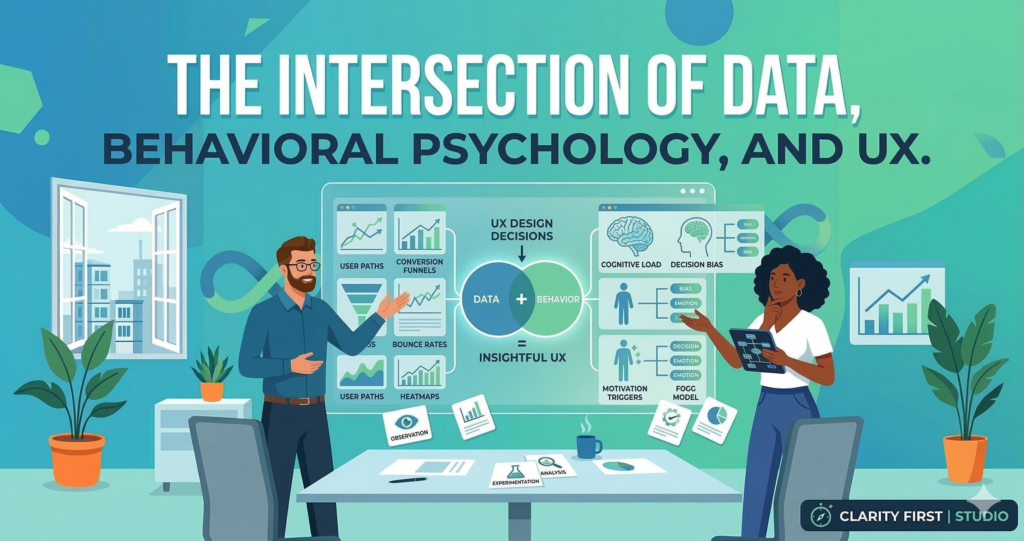
To build great interfaces, you must understand the human mind. The mix of data and psychology is the new frontier for UX pros. You need to know how people think and why they click.
Resources like Susan Weinschenk’s blog or Joe Leech’s work on psychology are great for this. They help you use “nudges” to guide users. But you can’t just guess what works. You need to verify your ideas by measuring UX metrics.
Using Numbers to Guide Art
Experts like Paul Amat and Kai Wong show us how design and data live together. Publications like MeasuringU also provide the tools for measuring UX metrics with scientific precision.
When you combine psychology with measuring UX metrics, you get a clear picture:
- Does this layout reduce stress for the user?
- Does this button color lead to more sales?
- Are people finishing their tasks without errors?
By measuring UX metrics every day, you turn your “gut feelings” into facts. This makes your design much harder to argue with in meetings.
5. Proving Tangible Value: Building Defensible Product Metrics.

At the end of the day, your design must help the business. Managers and stakeholders want to see Return on Investment (ROI). This is why measuring UX metrics is a skill every designer needs.
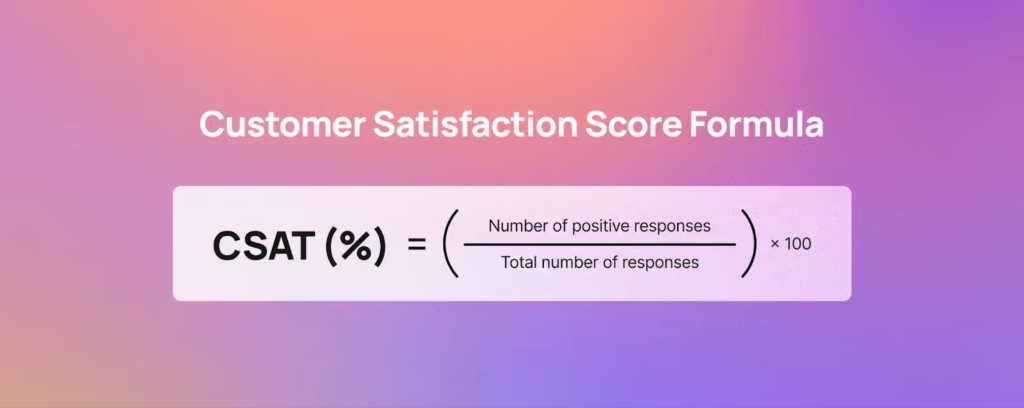
Basic numbers like “page views” don’t tell the whole story. You need deeper, more defensible data. This is why many teams are now measuring UX metrics through a “CX Score.”
What is a CX Score?
A CX Score (Customer Experience Score) combines several data points into one number. It looks at how happy users are, how fast they finish tasks, and how often they return. When you propose a bold new design, you can defend it by showing how it will raise the CX Score.
By measuring UX metrics this way, you prove that design is a business tool. You show that your work isn’t just about “making things pretty.” It’s about making things better.
6. Why Measuring UX Metrics Matters for the Long Run.

Many designers fear that data will kill their creativity. But the opposite is true. Measuring UX metrics gives you the confidence to take risks. If you have a safety net of data, you can try crazier ideas. If they work, the data proves it. If they don’t, you can fix them quickly.
Think of measuring UX metrics as a conversation with your users. They are telling you what they like and what they hate through their actions. Your job is to listen.
The Feedback Loop
Every great project should follow a simple loop:
- Plan: Use psychology to create a hypothesis.
- Build: Use no-code tools to make it real.
- Check: Start measuring UX metrics immediately.
- Fix: Use the data to make the design even better.
By repeating this loop, your product never stops improving. Measuring UX metrics becomes the heartbeat of your team. It keeps everyone focused on the user.
7. Stepping into the Future, Building Your Own Metric System.
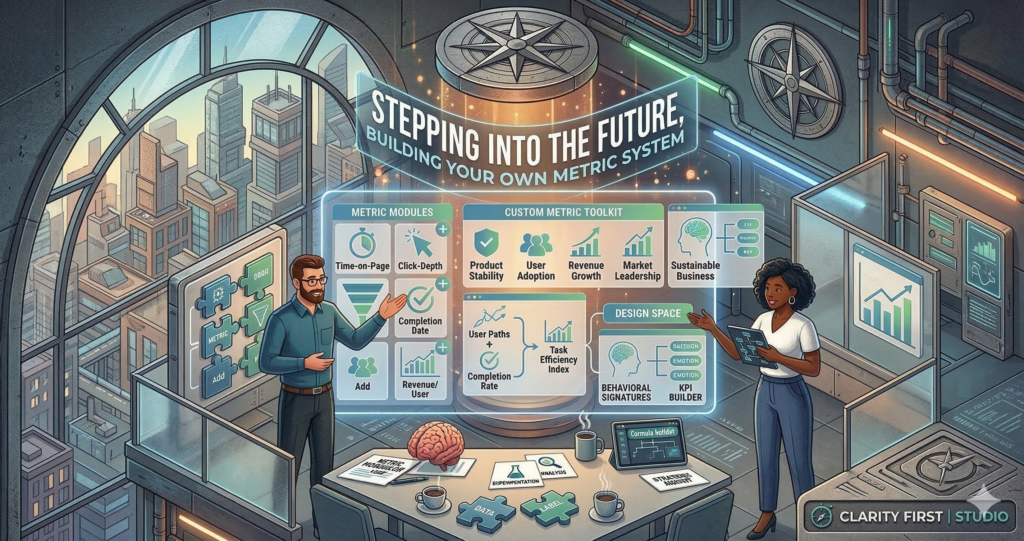
The digital world moves fast. Trends change every week. But the need for clear, useful products never goes away. By using tools like Webflow and following sites like Codrops, you can stay at the cutting edge. But by measuring UX metrics, you stay grounded in reality.
Don’t be afraid of the numbers. Embrace them. The best designers of the future will be part artist and part scientist. They will know how to create a cinematic scroll animation and how to explain its impact by measuring UX metrics.
To get started, don’t try to track everything at once. Pick three key things to watch. For most teams, these are:
- Success Rate: Did the user do what they came to do?
- Effort: How hard was it for them?
- Joy: Did they enjoy the experience?
Start measuring UX metrics for these three things. You will soon see patterns. You will see which parts of your design are working and which are not. This is the path to becoming a lead designer.
When you spend time measuring UX metrics, you are investing in your career. You are moving from being a “pixel pusher” to a “product leader.”
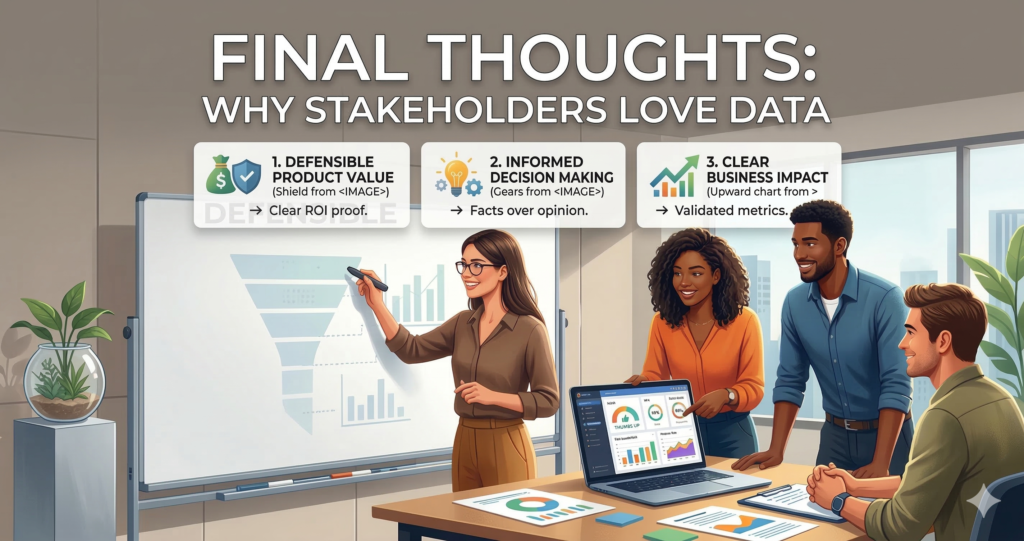
8. Final Thoughts Why Stakeholders Love Data.
The journey of a product designer is never over. There is always a new tool to learn or a new psychological trick to try. But as long as you keep measuring UX metrics, you will never be lost.
Your creativity is your greatest strength. Use it to build things that have never been seen before. Then, use the science of measuring UX metrics to prove why those things matter. This is how you win in the modern tech world.
By combining the “how” of no-code with the “why” of psychology and the “what” of measuring UX metrics, you become unstoppable. You create products that aren’t just beautiful—they are essential.
The no-code revolution is here. The data is ready. It’s time to start measuring UX metrics and showing the world what great design can really do. Whether you are working on a small app or a massive website, the rules are the same. Stay curious, stay creative, and never stop measuring UX metrics.
When you talk to a CEO, they might not care about “white space” or “serif fonts.” But they do care about the results of measuring UX metrics. They want to know if the design is saving money or making money.
If you can show a chart that proves your design reduced customer support calls, you have won. If you show that measuring UX metrics helped you find a bug that was stopping sales, you are a hero. This is why measuring UX metrics is the best way to get a bigger budget
The Path Forward.
Every advanced layout you build should be a chance to learn. Every interaction is a data point. By focusing on measuring UX metrics, you ensure that your visual experiments have a lasting impact on the world.
Mastering the Feedback Loop
To truly excel, teams must establish a continuous feedback loop:
- Hypothesize: Based on behavioral psychology and brand goals.
- Create: Using no-code tools for rapid deployment.
- Test: Rigorously measuring UX metrics in a live environment.
- Refine: Adjusting the design based on the data gathered.
This loop ensures that the product is always evolving in a direction that benefits both the user and the business. By consistently measuring UX metrics, teams can identify “friction points” that might have been overlooked during the initial creative phase.
In conclusion, by completely embracing limit-pushing platforms while simultaneously anchoring that creativity in robust information architecture, human psychology, and the disciplined practice of measuring UX metrics, modern product teams can guarantee lasting success. Whether you are building a boutique brand site or a complex SaaS platform, the path to excellence is paved with both beautiful pixels and hard data. Start measuring UX metrics today, and transform your creative vision into a defensible business asset.
Also Read: 12 Essential Artificial Intelligence and Machine Learning.
Leave a Reply